
 Open web. Clear feed.

SDM is your global partner for crypto liquidity. Offering OTC trading, payments, lending and derivatives. Telegram: t.me/SecureDigitalMarkets

bitcoin:native held the 200 week moving average near $64K and is now retesting the 50 week around $81K. That zone runs into the May high at $82.8K, so it's the most contested area on the weekly chart. Weekly closes either side of it are what we're watching.
The Fed holds rates steady at 3.5% to 3.75% in a 9 to 3 vote, with three regional presidents dissenting in favor of a hike. Chair Warsh reaffirms the 2% inflation target and offers no forward guidance
Eric Trump posted an ETH/BTC chart last Friday: "ETH is pumping hard! Crypto is the future." The Trumps aren't tourists here. This is a family that made $1.4B in crypto last year, more than any US-listed crypto company earned. When they talk, it's not sideline commentary, it's core portfolio positioning: → World Liberty Financial, the venture Eric co-founded, holds ~$131M of ETH, its second-largest position → Roughly $594M of that $1.4B came from WLF → Most importantly is the chart he chose: ETH/BTC (not ETH/USD). That's a rotation call ETH just went +13% on the week, double BTC's move, with ETF inflows behind it. Some non-technical indicators that could signal we are nearing ethereum:native's bottom
Interesting data point. bitcoin:native has bottomed in a midterm year every cycle since 2013: 2014 → -85%, 2018 → -84%, 2022 → -78%, 2026 → -48% so far Everyone is deep in ETF flows, gamma levels, and funding rates. Meanwhile the pattern that's actually held for 16 yrs is sitting right in front of us.

🚨 BREAKING: US CPI comes in soft across the board -Core CPI m/m: 0.0% (vs 0.2% forecast, 0.2% prior) -Core CPI y/y: 2.6% (vs 2.8% forecast, 2.9% prior) -CPI m/m: -0.4% (vs -0.1% forecast, 0.5% prior) -CPI y/y: 3.5% (vs 3.8% forecast, 4.2% prior) Inflation cooling faster than expected $BTC
bitcoin:native drops below $59.5K
NEXT WEEK: JOLTS, ISM, NFP. NFP is the print that matters. The full read is in this week's SDM Market Beat 👇 streamyard.com/watch/esJ6d99…

10/ On-chain: 80% of supply held by long-term holders, fresh high. Over half of supply at a loss, a level seen only near troughs. No bear ends without tagging the 200-week at 62.6K. Cycle location, not a trade signal.

9/ MSTR trading below 1.0 mNAV. STRC preferred closed 11% under par at $89 on a leveraged liquidation, yield 11-14%. The coupon isn't contractually defended.

8/ BTC below production cost for 5 straight months. ~20% of miners unprofitable. Difficulty beta to price now 0.62. The cost floor is reflexive, not a floor.

7/ Since March 30: Nasdaq +31%, BTC -4%. That spread is the entire crypto bear thesis. Capital isn't leaving risk, it's rotating to AI equities and IPOs.

6/ $4.5B into semiconductor ETFs in one week, among the largest on record. The tell is the IPO pipeline behind it. Healthier than '99 on fundamentals. Same distribution geometry.

5/ Iranian crude returns Aug 21. Sanctioned since 2018. ~20% of global supply context. A direct downward input to the inflation expectations driving the dot plot. The wildcard that unwinds the hawkish path.

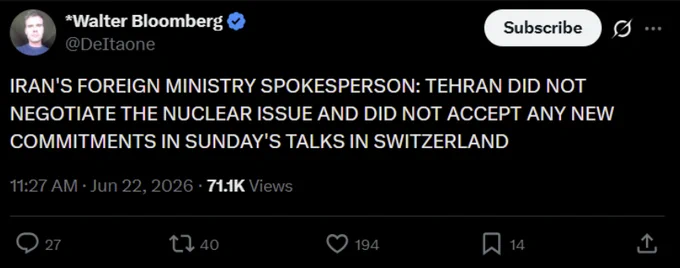
4/ Iran talks turned into dueling narratives over the weekend. Tehran says it never negotiated the nuclear issue. 60-day threat called an MOU violation. Skew richened to puts by ~7 vols on the headline risk alone.
3/ Goldman now models up to 3 hikes this year. Started January pricing 1-2 cuts. The entire path inverted off one meeting. Last comparable signal: Feb '22.
